Operator group ranking, Q4 2011 - Strong 3G sales see Chinese players make gains in latest Wireless Intelligence operator ranking
This insight is open to all subscribers and registered users, or available by completing the form.
The accelerating rollout of 3G in China has led to soaring sales at the country’s three main mobile operators, propelling them up the board in the latest GSMA Intelligence operator ranking study.
The new study ranks operator groups based on Q4 2011 mobile revenue, counting all subsidiaries in which the group has a majority economic ownership (e.g. a minimum of 50% plus one share).
The Chinese market-leader, China Mobile, strengthened its lead as the world’s largest operator in terms of revenue, growing quarterly sales by almost 14 percent year-on-year to US$22.7 billion in Q4, up from US$19.9 billion a year ago when the ranking study was last conducted.
Revenue growth was even more impressive at China Mobile’s two domestic rivals: China Unicom increased sales by 31 percent to US$4.3 billion, lifting it one place in the operator ranking to #15; China Telecom rose eight places to enter the top 20 for the first time at #19, growing sales by 56 percent to US$2.9 billion over the period.
The three Chinese operators began rolling out 3G in 2009; following a relatively slow start, uptake of 3G devices and services ramped up during 2011. According to an earlier GSMA Intelligence study, the number of 3G connections in China surpassed 200 million in Q4 2011 and accounted for 22 percent of the country’s total at year-end. 3G accounted for over 75 percent of new connections in the country in the quarter; Chinese 3G net additions in Q4 2011 were 27.4 million out of a total 36.2 million.
Unicom reported that full-year 3G service revenue in 2011 rose 182.3 percent year-on-year to CNY32.74 billion (US$5.2 billion), accounting for 31.7 percent of the operator’s total mobile service sales.
Elsewhere, the ranking study reaffirmed the strength of markets such as US and Japan. US market-leader Verizon Wireless overtook Vodafone Group to become the world's second-largest global operator in terms of revenue with sales rising 6 percent to US$15.1 billion. Vodafone slipped to #3 as sales declined 3 percent from a year ago (Vodafone’s 45 percent stake in Verizon Wireless is not counted). AT&T, the US number-two, was ranked at #4 and third-placed Sprint at #10. The Japanese operators also scored highly with NTT DOCOMO at #6, KDDI at #11 and SoftBank Mobile rising one position to #12.
By contrast, many operator groups with a strong presence in Europe recorded year-on-year revenue declines, a consequence of market saturation, fierce price competition and a slowdown in consumer spending due to the eurozone’s economic crisis. This was the case to some extent for revenue declines at Vodafone (#3), Telefonica (#5), Deutsche Telekom (#7), France Telecom (#8) and Telecom Italia (#13).
Meanwhile, VimpelCom’s completion of its US$6 billion acquisition of Wind Telecom last summer established the enlarged entity as the world’s sixth-largest operator group with over 200 million connections at year-end. In terms of its ranking by revenue, the acquisition saw VimpelCom rise seven places from a year ago to #14.
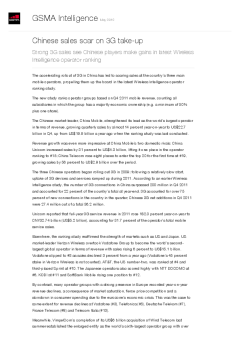
| Rank | Operator-group | Mobile revenue (US$ billion) 1 | YoY growth, revenue |
YoY change, rank |
Connections (million) 1 |
|---|---|---|---|---|---|
| 1 | China Mobile | 22.7 | 13.8% | - | 649.6 |
| 2 | Verizon Wireless | 15.1 | 6.4% | +1 | 108.7 |
| 3 | Vodafone Group | 14.7 | -3.1% | -1 | 383.9 |
| 4 | AT&T Group | 14.3 | 4.0% | - | 103.2 |
| 5 | Telefónica Group 2 | 12.2 | -0.1% | - | 238.7 |
| 6 | NTT DOCOMO Group | 12.2 | 5.7% | - | 59.7 |
| 7 | Deutsche Telekom Group | 8.9 | -5.1% | - | 106.7 |
| 8 | France Telecom Group | 7.9 | -1.9% | - | 103.9 |
| 9 | América Móvil Group | 7.6 | 5.5% | - | 241.8 |
| 10 | Sprint (Sprint Nextel) | 7.0 | 7.4% | - | 55.0 |
| 11 | au (KDDI) | 5.7 | -0.5% | - | 34.3 |
| 12 | SoftBank Mobile | 4.8 | 18.8% | +1 | 27.8 |
| 13 | Telecom Italia Group | 4.6 | -5.0% | -1 | 96.3 |
| 14 | VimpelCom Group | 4.6 | 87.9% | +7 | 200.3 |
| 15 | China Unicom | 4.3 | 31.4% | +1 | 199.7 |
| 16 | MTN Group 3 | 3.8 | -3.5% | -2 | 128.8 |
| 17 | Vivendi Group | 3.1 | -8.6% | -2 | 41.0 |
| 18 | Bharti Airtel Group | 3.0 | 3.2% | -1 | 233.0 |
| 19 | China Telecom | 2.9 | 55.6% | +8 | 126.5 |
| 20 | SK Telecom | 2.8 | -2.5% | -2 | 26.6 |
Mobile operator group global ranking by revenue, Q4 2011
Source: GSMA Intelligence, company reports
1 Connections and revenue are aggregated as the sum of each group's subsidiaries where a minimum of 50% plus one share economic interest is held
2 Revenue weighted by connections to adjust for fixed-line operations in certain geographies
3 Revenue includes (minority) fixed-line operations
Report details
Operator group ranking, Q4 2011 - Strong 3G sales see Chinese players make gains in latest Wireless Intelligence operator ranking
Download the report
Complete the form to get instant access to this content. For easier access in the future, you can register for a free account here.
By submitting this form, you agree that your email address and related activity on the platform will be processed for the purpose of generating and providing the requested report. Your data will be shared with GSMA Intelligence for this purpose. For more information, please see the GSMA Intelligence Privacy Policy.
Related research
GSMA Open Gateway: State of the Market, H1 2026
This latest edition of the GSMA Open Gateway research series provides an update on the state of the market, recent developments and examples of Open Gateway in action. The market is increasingly moving away from operator-specific API exposure and towards platform-mediated distribution, where developers prefer a single integration point with global reach. This changes the commercial dynamic for the ecosystem.
Efficient operator scale in European mobile markets
European mobile markets are undergoing a structural shift: rising data usage, declining revenue per user, saturating subscriber penetration and sustained investment requirements have made operator scale increasingly important. Europe remains the least concentrated major mobile region in the world, with operators being structurally subscale compared to global peers. This gap has widened during precisely the period when scale matters most.
Fixing the middle mile in mobile networks: a multi-technology assessment for the 5G era
To aid operators that are evaluating middle-mile transport solutions, GSMA Intelligence has developed the TCO Calculator, based on research and analysis of existing and emerging middle-mile transport solutions across a number of deployment scenarios around the world. The rapid expansion of 5G networks is driving an unprecedented surge in mobile data consumption, which is placing immense pressure on the middle mile. As a result, operators must diversify their product/solution mix for middle-mile transport.
Authors
How to access this report
Annual subscription: Subscribe to our research modules for comprehensive access to more than 200 reports per year.
Enquire about subscriptionContact our research team
Get in touch with us to find out more about our research topics and analysis.
Contact our research teamMedia
To cite our research, please see our citation policy in our Terms of Use, or contact our Media team for more information.
Learn more- 200 reports a year
- 50 million data points
- Over 350 metrics
How can we support you?
Get in touch
Contact the GSMA Intelligence support team for help with your account, subscriptions, or access to reports and insights.
Newsletter
Subscribe to the GSMA Intelligence newsletter for the latest industry news and insights, delivered to your inbox.