Global LTE network forecasts and assumptions - one year on - Over 200 live LTE networks forecast by 2015 using 38 spectrum frequency combinations
This insight is open to all subscribers and registered users, or available by completing the form.
Our latest report — Global LTE network forecasts and assumptions - one year on — is now available for download.
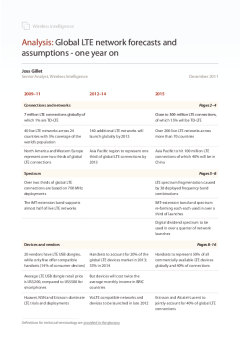
GSMA Intelligence predicts that there will be 38 different spectrum frequency combinations used in LTE deployments by 2015, a fragmented scenario fuelled by ongoing spectrum auctions, licence renewals and re-farming initiatives across a wide range of frequency bands.
The lack of spectrum harmonisation represents a key challenge for the emerging LTE ecosystem, potentially preventing vendors from delivering globally compatible LTE products such as devices and chipsets.
Spectrum fragmentation has the potential to hinder global LTE roaming if device manufacturers are required to include support for many disparate frequencies in their devices. Given the backwards compatibility already required for either HSPA or EV-DO connectivity, we are unlikely to see a 'world' device in a handset form-factor soon.
GSMA Intelligence forecasts that there will be over 200 live LTE networks in more than 70 countries by 2015, up from 40 networks in 24 countries today. The number of LTE connections is forecast to grow from 7 million to close to 300 million over the same period.
Report details
Global LTE network forecasts and assumptions - one year on - Over 200 live LTE networks forecast by 2015 using 38 spectrum frequency combinations
Download the report
Complete the form to get instant access to this content. For easier access in the future, you can register for a free account here.
By submitting this form, you agree that your email address and related activity on the platform will be processed for the purpose of generating and providing the requested report. Your data will be shared with GSMA Intelligence for this purpose. For more information, please see the GSMA Intelligence Privacy Policy.
Related research
The cost of removing designated third-country vendors from EU telecoms networks
As digital infrastructure becomes increasingly central to key economic and social outcomes, policymakers are placing a greater emphasis on security and resilience. A key development in this context is the European Commission’s proposal to strengthen cybersecurity requirements through an updated regulatory framework – Cybersecurity Act 2 (known as CSA2). This includes provisions that require the removal of critical equipment supplied by designated high-risk vendors from telecoms infrastructure within a defined timeframe. GSMA Intelligence has conducted unique research to assess the cost of removing critical components from high-risk vendors from European telecoms networks.
Financial sustainability: mobile operator scale
Financially strong operators are essential to improve network quality, expand coverage, support growth in capacity and deliver new network functionality linked to 5G standalone, AI and beyond. However, over the past decade, structural trends have placed increasing pressure on the industry’s financial foundations. This report is the first in a series that seeks to address a critical evidence gap in the understanding of the financial sustainability of the mobile sector and its main drivers.
GSMA Open Gateway: State of the Market, H1 2026
This latest edition of the GSMA Open Gateway research series provides an update on the state of the market, recent developments and examples of Open Gateway in action. The market is increasingly moving away from operator-specific API exposure and towards platform-mediated distribution, where developers prefer a single integration point with global reach. This changes the commercial dynamic for the ecosystem.
Authors
How to access this report
Annual subscription: Subscribe to our research modules for comprehensive access to more than 200 reports per year.
Enquire about subscriptionContact our research team
Get in touch with us to find out more about our research topics and analysis.
Contact our research teamMedia
To cite our research, please see our citation policy in our Terms of Use, or contact our Media team for more information.
Learn more- 200 reports a year
- 50 million data points
- Over 350 metrics
How can we support you?
Get in touch
Contact the GSMA Intelligence support team for help with your account, subscriptions, or access to reports and insights.
Newsletter
Subscribe to the GSMA Intelligence newsletter for the latest industry news and insights, delivered to your inbox.