A closer look at MVNOs: What 2100+ MVNOs tell us about the trends, shifts and the outlook

When we launched our latest MVNO State of the Market report, we always knew it would garner interest but the scale of response that we received on our accompanying webinar was a surprise. It turned out to be one of our most highly attended sessions, drawing a broad mix of players from the ecosystem. Such diversity and volume usually signal a topic important to the industry. It was clear: MVNOs are not a sideline discussion topic but require centerstage.
Not everyone could attend the webinar. Not everyone has access to the full report. So here are some of the high-level insights shaping the next chapter of the MVNO market.
A market that has quietly grown
The global MVNO count today stands at around 2,100+ representing more than 60% increase over the last decade. Ten years ago, this number was closer to 1,300. What’s interesting is not just the growth itself, but where it is happening.
Europe and APAC continue to dominate - Together, the two regions still account for around 70% of all MVNOs globally, almost unchanged from a decade ago. But the underlying dynamics are shifting.
Latin America is emerging. The number of MVNOs in Latin America has grown nearly fivefold in the last decade, signalling that the model is gaining traction in markets where it historically had a limited presence.
Pockets of momentum in Africa. South Africa has a good MVNO presence already whereas countries like Uganda and Nigeria and South Africa are beginning to show more MVNO activity.
A surprising gap in market presence - Only 42% of countries worldwide currently host at least one MVNO. This means 58% of markets still have no MVNO presence at all. Not all of these remaining countries will be commercially viable or regulatorily suitable for MVNO development, but many certainly are indicating the room for MVNOs to grow geographically.
A market concentrated among a few countries
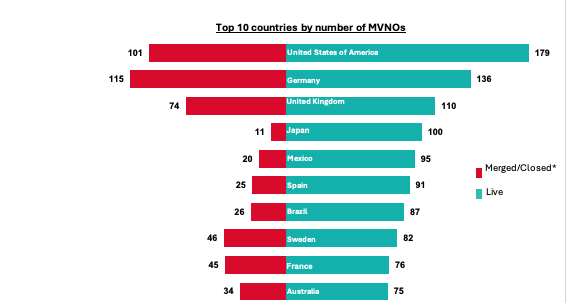
Despite global expansion, the MVNO footprint remains uneven. Out of the ~100 countries with active MVNOs, just ten account for nearly half of all MVNOs worldwide as illustrated below. The United States alone hosts about 8% of the global count, even though it consistently sees high MVNO closure rates. The top 10 countries highlights a pattern – presence and scale of MVNOs does not automatically translate to stable long-term sustainability.
So, what enables MVNO entry—and what enables survival?
Through our two-part framework – The Lauch and Last matrix in report, we examined both the conditions that enable MVNOs to enter a market and those that allow them to sustain themselves once established.
Ease of launch is shaped by how supportive and open a country’s regulatory and wholesale environment is, the willingness of host MNOs to offer access, the strength of available retail and distribution networks, and whether aspiring MVNOs can clearly identify and target a viable customer segment.
Survival probability, on the other hand, is determined by a more complex interplay of commercial and structural factors: the type of wholesale pricing models available, the extent of competitive pressure from MNO sub-brands, the overall stability of regulatory policies, and whether the MVNO can create a differentiated and defensible market position. These variables influence long-term margins, customer loyalty, and strategic resilience.
What emerges clearly from this analysis is that there is no direct correlation between ease of entry and long-term sustainability. Markets like the United States score highly on launch friendliness yet experience significant churn and closure, whereas markets like Japan support some of the most stable MVNO ecosystems despite being comparatively harder to enter. The lesson is simple: getting in is one part of the story; staying in is a completely different one.
Sub-brands, full MVNOs and the competitive mix
The market’s competitive intensity is increasingly shaped by the presence of sub-brands and full MVNOs. Globally, there are 265 sub-brands, with Europe displaying the highest sub-brand-to-MVNO ratio. At the same time, 96 full MVNOs operate across markets, with Brazil emerging as one of the strongest hubs for full-MVNO development. Business models continue to evolve across regions, but globally, discount-led value propositions still dominate, even a decade after they became mainstream.
What will shape the next phase of MVNO growth?
Looking ahead, we expect the MVNO market to expand further, not simply in terms of numbers, but in diversity of models and depth of ecosystem participation. Several forces will drive this shift:
- eSIM is reducing entry barriers, reducing the need for physical distribution channels and enabling digital-first MVNO launches.
- 5G is opening new differentiation avenues, allowing MVNOs to design propositions around low latency, richer digital services, gaming, and new experiential offerings.
- The enterprise and IoT opportunity is expanding, pushing MVNOs into B2B spaces with bundled connectivity and sector-specific solutions.
- Cloud-native infrastructure is transforming operating models, reducing time-to-market and enabling MVNOs to scale more efficiently without heavy physical investments.
Together, these trends point toward a more diverse MVNO landscape.
What’s next?
As the market continues to evolve, our 2026 edition will explore in greater detail how eSIM adoption is influencing MVNO economics, the types of new models emerging, and how different markets are shaping distinct paths of MVNO success and challenges. We will also look more closely at the role of enterprise- and IoT-focused MVNOs as these segments mature.
For now, what the current data suggests is that MVNO activity is broadening in both scale and scope, with different regions and business models progressing at their own pace. The overall direction will depend on how regulatory conditions, wholesale dynamics, technology adoption, and operator strategies continue to develop over the next few years.
Data correct to August 2025 - Source: GSMA Intelligence
Author

- 200 reports a year
- 50 million data points
- Over 350 metrics
How can we support you?
Get in touch
Contact the GSMA Intelligence support team for help with your account, subscriptions, or access to reports and insights.
Newsletter
Subscribe to the GSMA Intelligence newsletter for the latest industry news and insights, delivered to your inbox.